
Encinitas Finance Decoder
The Strong Towns Finance Decoder, developed by Strong Towns, is a simple tool designed to help communities better understand the financial health of their cities. Instead of focusing only on annual budgets, it looks at the bigger picture: how development patterns, infrastructure investments, and growth decisions affect a city’s long-term financial sustainability.
For Encinitas, this approach can help residents and local leaders ask important questions:
Are our public investments financially sustainable?
Are we maintaining the infrastructure we already have?
And how can we grow in ways that strengthen both our community character and our long-term financial resilience?
The goal of this Finance Decoder exercise is not to promote a particular outcome, but to give the community a clearer understanding of how our city’s finances work and how today’s decisions shape Encinitas’ future.
We’ve collected data from Encinitas standard accounting forms from 2009 to 2025. You can view the Finance Decoder for Encinitas here.
Sustainability Indicators
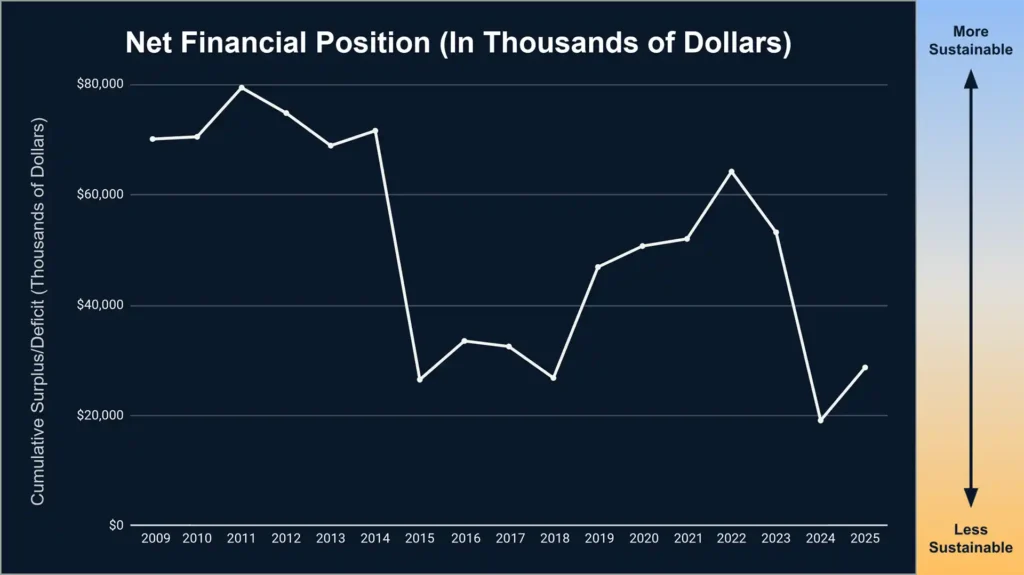
Net Financial Position
What it is:
The difference between the city’s financial assets (like cash and receivables) and its liabilities (like debt and pensions). This is the cumulative surplus/deficit accumulated by the city over successive budget cycles.
What it tells you:
A positive net financial position suggests the city has more financial assets than liabilities and is better positioned to weather downturns, invest in infrastructure, or respond to emergencies without resorting to borrowing or service cuts. If this number is negative, the city has spent more than it has saved and is relying on future revenue to pay past bills.
What the trend shows:
A downward trend means the city is growing more reliant on borrowing or deferring payments. An upward trend means it’s becoming more financially secure.
Financial Assets-To-Total Liabilities
What it is:
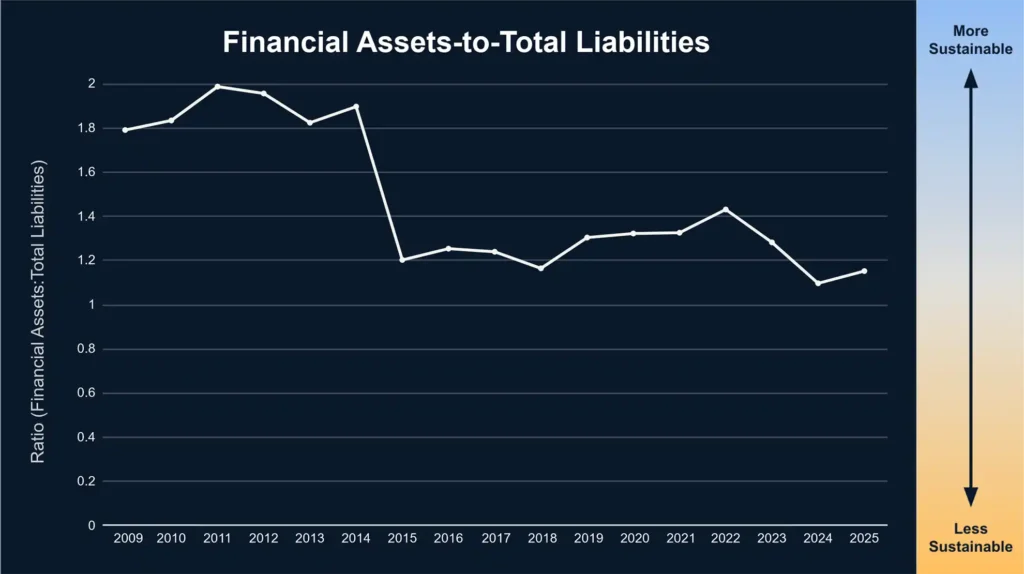
The city’s financial assets—such as cash, receivables, and other short-term holdings—divided by its total liabilities. This is a different way of presenting the Net Financial Position.
What it tells you:
This ratio indicates whether the city has sufficient liquid financial resources to cover its obligations. A ratio below 1 means it cannot pay off its liabilities with only its financial assets, indicating financial stress.
What the trend shows:
A rising trend means the city is improving its financial buffer. A falling trend suggests the city is becoming less able to handle its obligations without borrowing or cutting services.
Total Assets-To-Total Liabilities
What it is:
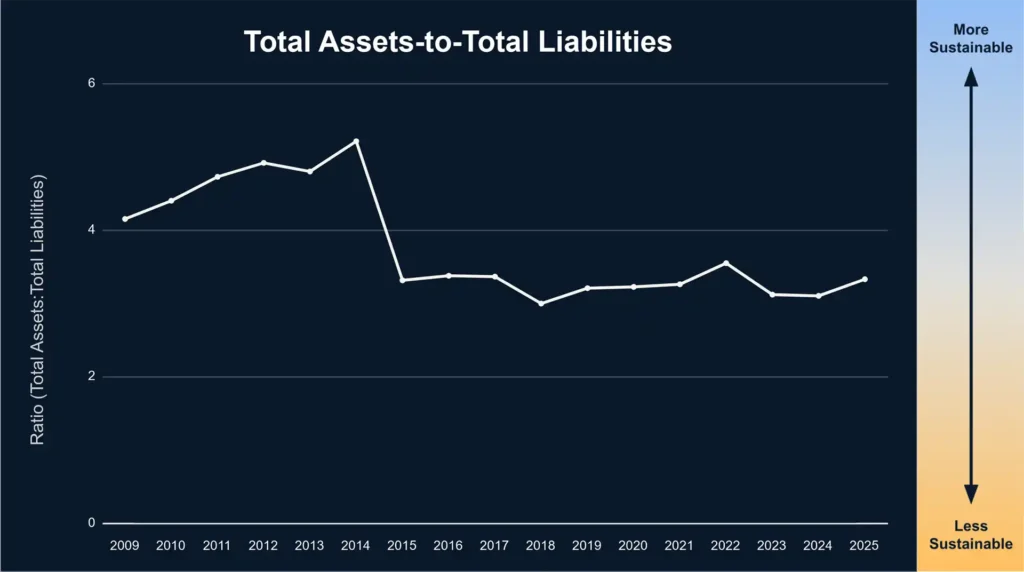
The value of all the city’s assets (including infrastructure) divided by its total liabilities.
What it tells you:
A ratio above 1 means the city owns more than it owes (solvent). A score below 1 means it owes more than it owns (insolvent).
What the trend shows:
A downward trend means the city is becoming less solvent. An upward trend shows improving financial resilience.
Net Debt-to-Total Revenues
What it is:
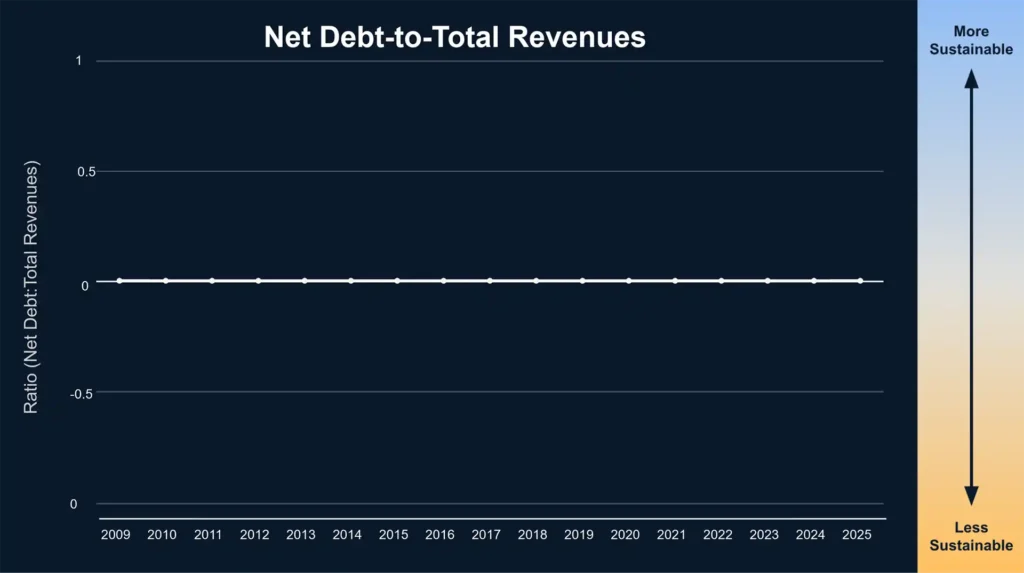
The total liabilities the city owes relative to the revenue it collects in a year.
What it tells you:
This shows how many years of income it would take to pay off all debts if every dollar went to debt repayment.
What the trend shows:
If the ratio is rising, debt is growing faster than income—this is unsustainable. If it’s falling, the city is gaining control of its obligations.
Note:
If this graph shows a flat line at 0 after inputting your city’s numbers, this means that the city has a net surplus (no net debt).
Flexibility Indicators
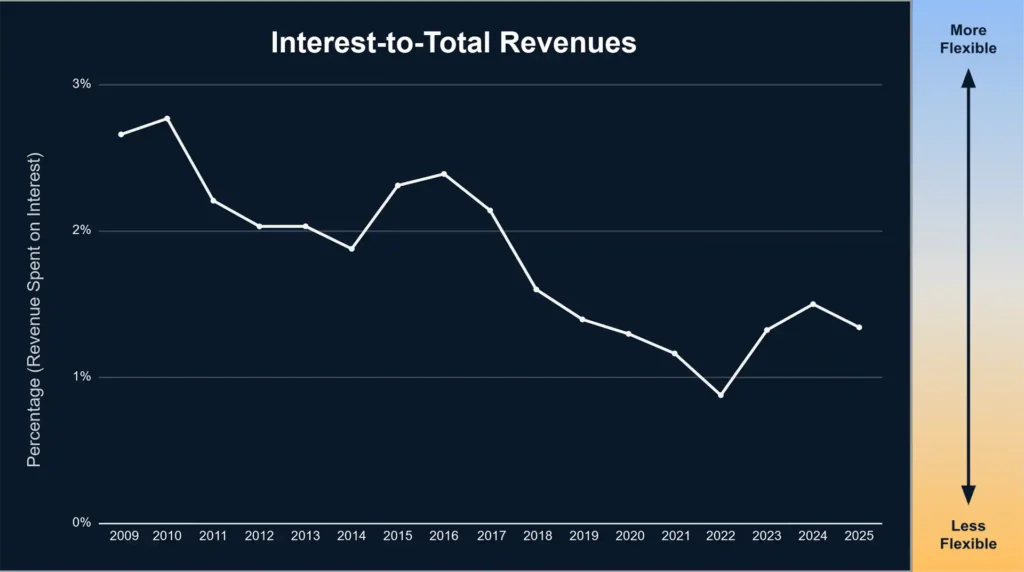
Interest-to-Total Revenues
What it is:
The percentage of annual revenue spent on interest payments.
What it tells you:
This shows how much of the budget is consumed by past borrowing. The higher the percentage, the less room for services, maintenance, or investment.
What the trend shows:
An increasing trend limits future choices and can crowd out basic services. A decreasing trend improves flexibility and budget health.
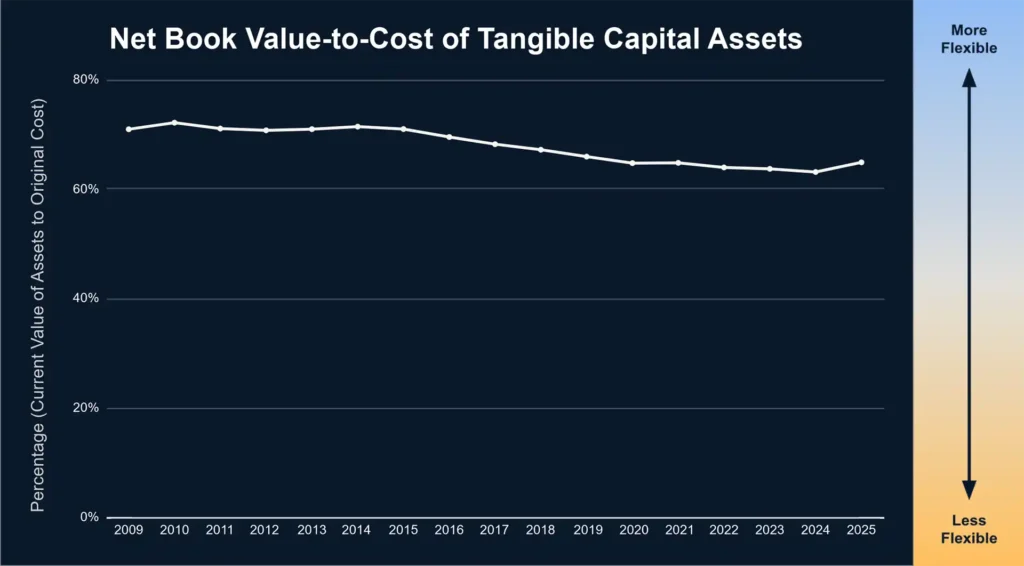
Net Book Value to Cost of Tangible Capital Assets
What it is:
The current value of the city’s physical assets compared to their original cost.
What it tells you:
This indicates how well the city is maintaining its infrastructure. A low value means assets are aging and wearing out.
What the trend shows:
A declining trend means the city is falling behind on maintenance. A stable or rising trend suggests it is keeping up.
Vulnerability Indicator
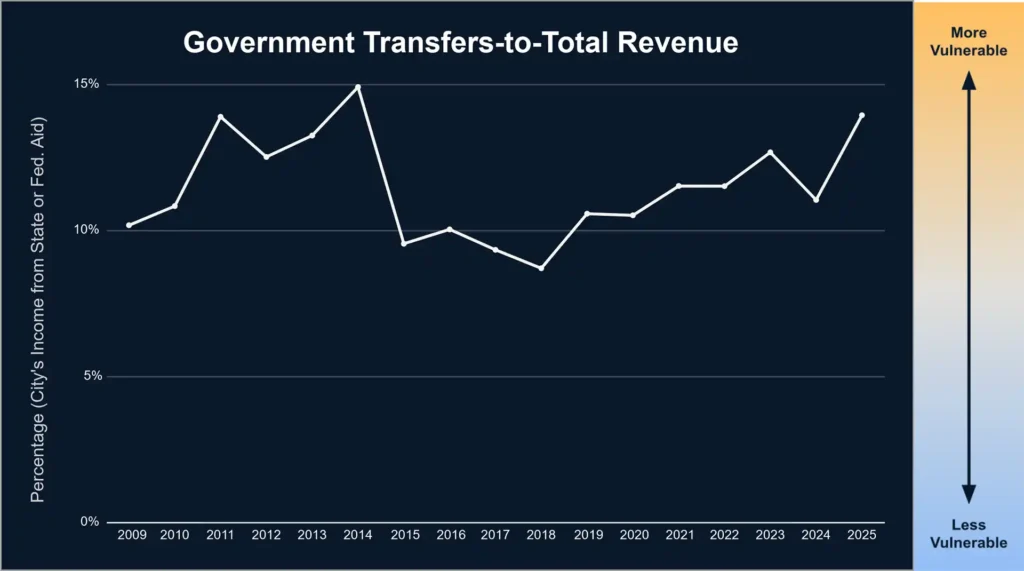
Government Transfers to Total Revenue
What it is:
The share of the city’s income that comes from state or federal aid.
What it tells you:
High dependency on outside funding makes the city vulnerable to political or economic shifts beyond its control.
What the trend shows:
If the trend is rising, the city is becoming more dependent on outside help. If it’s falling, the city is strengthening its local revenue base.
Notes
An Annual Comprehensive Financial Report (ACFR) is a detailed, audited financial report that provides a comprehensive overview of a government entity’s financial position and activities for a fiscal year. It is typically issued by state and local governments, including cities, counties, and public institutions in the United States.
ACFR reports are prepared in accordance with Generally Accepted Accounting Principles (GAAP) under guidelines set by the Government Accounting Standards Board (GASB) in the US.
All of the data used in the Fiscal Health Assessment can be extracted from the ACFR, specifically from reports included in the Management Discussion & Analysis (MD&A) and Basic Financial Statements: Notes sections.
Be sure to note whether or not rounding is applied to displayed numbers. Most reports are presented in thousands ($000), some in millions, and others in whole dollars (no rounding). Note that reports from different sections of the same ACFR may be presented with different rounding. Reporting on Capital Assets in the Notes section, for example, is often presented in whole dollars even when other sections are rounded to the thousands or millions. Be sure to use consistent rounding when entering data.
Each ACFR includes current and prior-year data for comparison. Data from prior years are often restated or amended in the following year’s report. Be sure to update prior year data if you notice restatements.
In 2011 and 2012, GASB issued statements requiring separate reporting of deferred inflows and outflows of resources to align governmental accounting with the economic resource measurement focus and the accrual basis of accounting, ensuring that deferred resources are reported separately from assets and liabilities. The statements provided additional guidance on what qualifies as deferred inflows and outflows and required reclassification of certain items previously recognized as assets or liabilities.
Total Cost of Capital Assets is the sum of the purchase cost of all capital assets, prior to subtracting accumulated depreciation. These costs are reported in the Notes under Capital Assets, usually in two major categories: Governmental Activities and Business-Type Activities. Some cities will further break down the Business-Type Activities to specific uses, such as airports, water and sewage, and/or convention centers. Be sure to capture the costs under each of these categories.